In our previous blog, we shared that large employers today are dedicating as much as 30 percent of their total healthcare benefits spend to pharmacy while one in four Americans can’t afford their prescription medications.
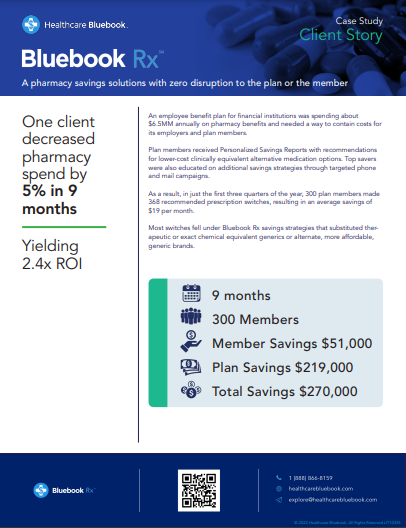
With the launch of Bluebook Rx™, benefits leaders are learning the broad value of cost transparency as they vet ways to eliminate waste and cut pharmacy spend. Healthcare Bluebook’s pharmacy savings solution mitigates rising prescription drug costs by analyzing a member’s claims data to identify over-priced medications and suggesting lower cost clinically equivalent alternatives they can discuss with their doctor.
Our recent webinar, Prescription for Success: Using Cost Transparency to Lower Your Pharmacy Spend, was an eye-opener for benefits leaders in search of pharmacy cost-cutting methods that work.
Bluebook’s Director of Pharmacy Samantha McMaster, PharmD and Director of Client Success Jason Pilote discussed the top drivers of drug costs, which have become the most significant pain point for employers. Below are highlights from the discussion.
Specialty medications – those that require support beyond traditional dispensing – drive 80 percent of pharmacy costs, yet only account for 10 percent of U.S. prescriptions. In 2022, specialty medications are predicted to account for 50 percent of total pharmacy spend.
Unfortunately, employers are largely at the mercy of their pharmacy benefits managers (PBMs) who often protect their profits by shrouding drug prices with multiple rebates and spread pricing, making it nearly impossible for employers to know the true prices of drugs so they can manage those costs.
“As a consumer, I never know what my medications are going to cost until I get to the pharmacy,” explained McMasters. “It could be $10. It could be $150. It’s the same for employers. Not only are Americans spending more for brand medications, but they’re also taking more medications per capita than any other nation in the world, which, along with specialty meds utilization, is causing the rapid increase in drug costs.”
In 2020, Americans spent nearly twice as much on the top 20 selling prescription drugs worldwide — $101 billion — compared to $57 billion for the rest of the world.
Spread pricing occurs when the PBM charges a plan sponsor more than what they pay the pharmacy for a medication, then keep the spread — or difference in cost — as profit.
In other words, the PBM pays one price for a medication to the pharmacy and then charges the plan sponsor a much higher price, which can increase overall Rx costs by as much as 15 to 30 percent.
But unless a plan sponsor regularly audits current contracts and invoices, they typically don’t know that spread pricing is occurring.
A Medicaid claims audit in the state of Ohio in 2017 and 2018 revealed that the state paid more than $1 million in additional charges for one medication alone. Through its largely CVS/Caremark-controlled Medicaid managed care program, Ohio paid more than $280 per prescription for omeprazole (generic Prilosec), a drug that could be acquired off the shelf for around $15.
“This is a textbook example of concerns taxpayers have across the nation and (underscores) the need for transparency across the entire drug-supply chain.” – Maureen Corcoran, Ohio Medicaid Director.
On average in 2017, spread pricing was approximately $6 per prescription, which means that for every script filled in Ohio and for Ohio Medicaid, there was an upcharge to the state in addition to the cost of medication dispensing fees.
According to Pilote, a recent review of a Bluebook client’s data revealed that specialty medications only accounted for 1.5 percent of the client’s pharmacy volume, but 48 percent of total costs.
“Immediate options to address the imbalance are difficult for employers to manage,” he explained. “They can try to adjust the formulary to remove low value drugs but that’s typically a lengthy process if they can make the changes at all. Removing the drugs could also cause significant disruption for members and benefits managers.”
Bluebook Rx is modeled after the Bluebook CareConnect™ member concierge solution that provides personal one-on-one assistance to members in need of complex medical procedures.
“The [Bluebook CareConnect] program has never received less than a five star review in the last four years,” said Pilote. “We’ve built directly off that platform of compassion and expertise with a caring group of clinicians and pharmacists who are eager to guide members to high value medications. Every patient has the support they need with Bluebook Rx.”
The Bluebook Rx team proactively educates members on their savings opportunities through the communication channel of their choice such as emails, texts, mailers, or by phone with a concierge.
“Our goal with Bluebook Rx is to provide a simple, hassle free experience that both encourages the utilization of high value drugs and saves money for the member and the plan,” he said.
The Bluebook Rx approach meets clients where they are with their existing formularies and benefits design.
“We know there are countless challenges in lowering pharmacy costs, and therefore, different tools to help solve the problem,” explained McMaster. “Bluebook Rx is designed to complement all the strategies that may be in place by the PBM or other external partners. It’s a low friction solution designed to empower members by raising awareness of the available choices with their pharmacy benefit.”
Bluebook Rx helps analyze and manage the total cost of care with a combination of pharmacy and medical claims information to create pharmacy cost transparency — a game-changer for organizations.
We invite you to view the webinar transcript. For more information, contact a Bluebook Rx representative today.
[This information is directly from the Bluebook Rx Webinar except where otherwise cited via link.]
