
The launching of Outcomes Analytics+ marks an exciting shift in the field of healthcare analytics as the inclusion of outpatient data alongside inpatient data provides unprecedented access to insights, analysis, and performance comparatives.
For nearly three decades, Quantros has been helping clients analyze and improve their performance with its vast dataset of 30 million CMS fee-for-service claims and 21.7 million all-payer claims. That dataset is set to grow exponentially in our new software Outcomes Analytics+ with the addition of outpatient data, adding more than 500,000 new physicians and 175 million additional patient encounters each year.
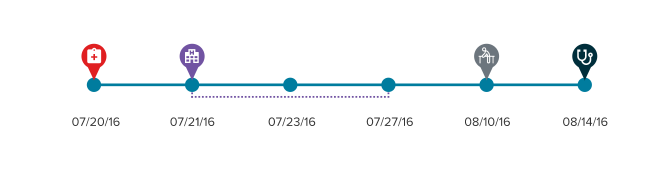
Outcomes Analytics+ will allow for the analysis of a patient’s full sequence of care (estimated to release mid-2021): capturing all encounters related to a specific diagnosis or procedure, even if that includes multiple facilities and multiple physicians.
Patient episodes are grouped by diagnosis or procedure, leveraging Optum’s Procedure Based Groups (PEGs) and Episode Treatment Groups (ETGs) allowing for incredible granularity of focus when drilling-down to inspect performance scores for specific procedures.
In addition to being able to track a specific patient’s health journey, users can compare and contrast outcomes and efficiency between inpatient and outpatient settings.
Capturing complete patient episodes also allows for improved physician attribution, and all practitioners associated with a patient’s care now share responsibility for that patient’s outcomes.
Recognizing that patient populations vary between both healthcare providers and physicians, Outcomes Analytics+ adjusts for risk, examining patient age, gender, and comorbidities. A new innovation of scoring a patient’s comorbidities, rather than merely counting them, allows for the fact that not all comorbidities have an equal impact on the likelihood of an adverse event, and some comorbidities actually can have a positive effect making adverse events less likely. This more sophisticated approach enables more accurate risk-adjustment overall, and for the effect of a comorbidity on the outcome of interest to vary by the main diagnosis or procedure type.
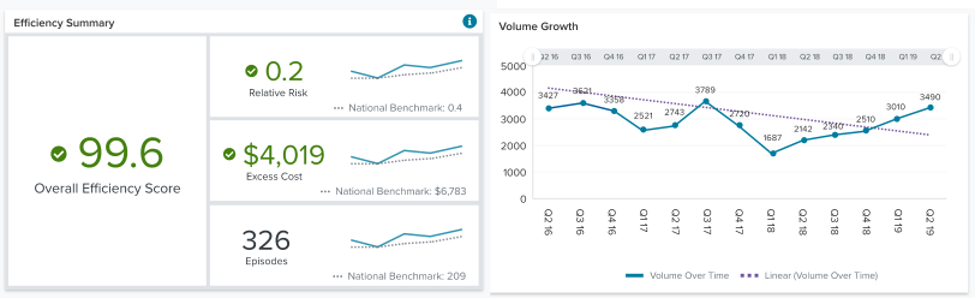
Outcomes Analytics+ takes a similar approach when measuring efficiency, adjusting for variation in patient characteristics: age, gender, and the same comorbidity classes mentioned above. Since regional differences can also have a large impact on cost (a hospital in New York is not likely to have the same charges as a hospital in Alabama) Quantros also controls for facility-level factors, examining historic billing practices to establish a provider’s rate of inflation or deflation.
Physicians and facilities continue to be scored and ranked in critical quality metrics such as mortality, complications, unplanned encounters (an expansion of readmissions across inpatient and outpatient settings), and patient safety, but new, key metrics have been introduced as well such as value and appropriateness of care.
As CMS increasingly moves towards a value-based reimbursement model, the value score in Outcomes Analytics+ provides critical insight. Research shows that cost and quality do not necessarily correlate within healthcare, so rather than only looking at price information and assuming that greater value is attained by lower cost, Quantros measures the intersection of quality outcomes and efficiency.
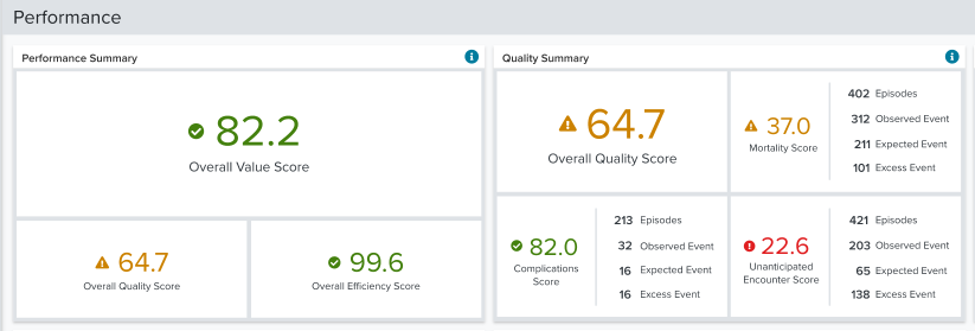
Scores in mortality, complications, and unplanned encounters are combined to create an Overall Quality Score which captures facility and physician performance at-a-glance.